Optogenetics
How it works
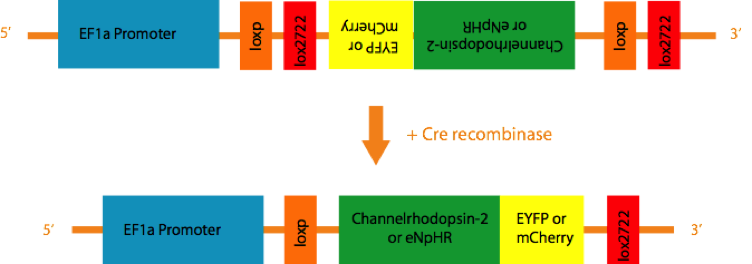
An Adeno-associated virus (AAV) is created that contains the inverse coding sequence for a fusion protein consisting of a fluorescent reporter (EYF P or mCherry) and a light activated cation channel, Channelrhodopsin-2 (ChR2), or a Cl- pump, Halorhodopsin(eNpHR), flanked by two pairs of incompatible loxP sites. When injected into the brain, the virus infects neurons indiscriminately. However, since the coding sequence is inverse, no gene product is expressed in most neurons. But in the presence of the enzyme Cre-recombinase, a recombination of either loxP variant takes place, resulting in the permanent inversion of the coding sequence into the sense direction, followed by expression of the light-activated channels. By using special strains of transgenic mice that only express Cre recombinase under the control of specific promotors such as TH or ChAT, expression of the light sensitive channels and reporters are constrained to cells that express TH or ChAT.
Glutamate release from mesoaccumbens DA neurons
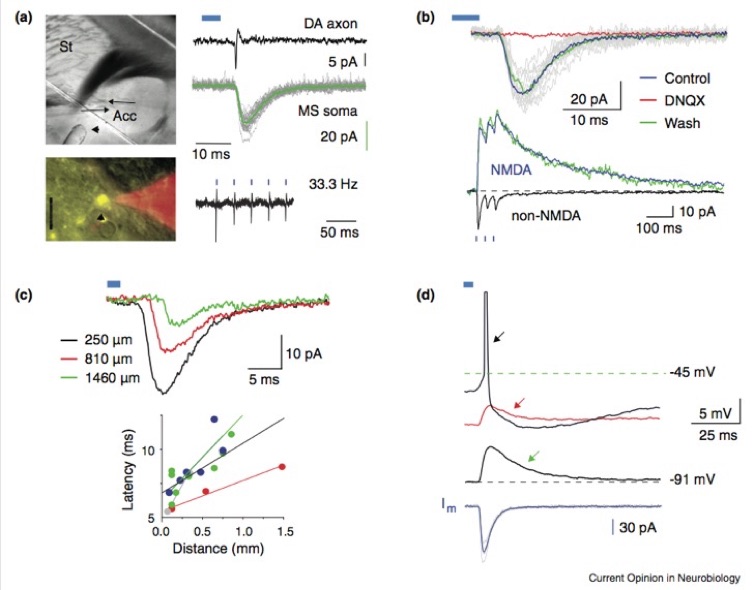
a. Optical activation of DA axons in the accumbens. DIC photomicrograph illustrates location of recording site (note the position of 2 patch pipettes used for simultaneous cell-attached axonal, and whole cell recordings (arrows) and the position of the optical fiber (arrowhead), used for focal stimulation). Epifluorescence composite micrograph illustrates a typical axon bleb formed by the severing of a DA axon expressing ChR2-EYFP (yellow structure, arrow) at the surface of the slice and the cell attached recording pipette (red) used for axon recordings. Right panel, top: response of a ChR2-EYFP expressing DA axon exhibiting a single optically elicited AP. Middle traces are simultaneously recorded synaptic responses in a nearby SPN (‘MS soma’, green trace is the average, gray traces are individual responses). Bottom trace illustrates reliable firing of APs in in a DA axon in response to a 33.3 Hz train of light pulses. Blue bars indicate light pulses in all panels. B. Glutamatergic EPSCs recorded in 2 SPNs in response to optical stimulation of DA axons (blue bars). Top panel, a single light pulse elicits EPSCs (individual EPSCs are in gray, the average EPSC is in green) that are reversibly and completely blocked of the selective AMPA receptor antagonist DNQX. Bottom panel: synaptic responses in an SPN to optical train stimuli. Responses recorded at the resting membrane potential (black trace, ‘non-NMDA’) and at +50 mV (blue and green traces) are shown. The NMDA receptor mediated component (‘NMDA’, blue trace) was isolated with block of AMPA receptors (CNQX, 10 mM). C. Distal stimulation of DA axons elicits EPSCs in SPNs that are triggered by propagating APs, demonstrating that the EPSCs are not artifacts of direct ChR2 induced release from axon terminals. Top panel shows 3 average EPSCs elicited by stimulating at increasing distances from the neuron. Corresponding distances are indicated in the panel. Bottom panel shows fitted linear correlations of latencies of EPSCs and simulation distances in 3 experiments. Note the slow conduction velocity indicated by the slope of the linear fits. D. EPSPs and their effects on firing in an SPN. Bottom trace is the average EPSC recorded in voltage clamp at the resting membrane potential of this neuron (–91 mV). Top traces are voltage recordings with different levels of depolarizing current injected into the neuron. Note that an AP (black arrow) could be elicited only when the neuron was depolarized to 5 mV below AP threshold but not at lower levels of depolarization (red and green arrows). From Koós, T., Tecuapetla, F., & Tepper, J.M. (2011) Glutamatergic signaling by midbrain dopaminergic neurons: recent insights from optogenetic, molecular and behavioral studies. Curr. Opin. Neurobiol. 21:393-401.
IPSPs in spiny neurons elicited by optogenetic activation of striatal TH interneurons
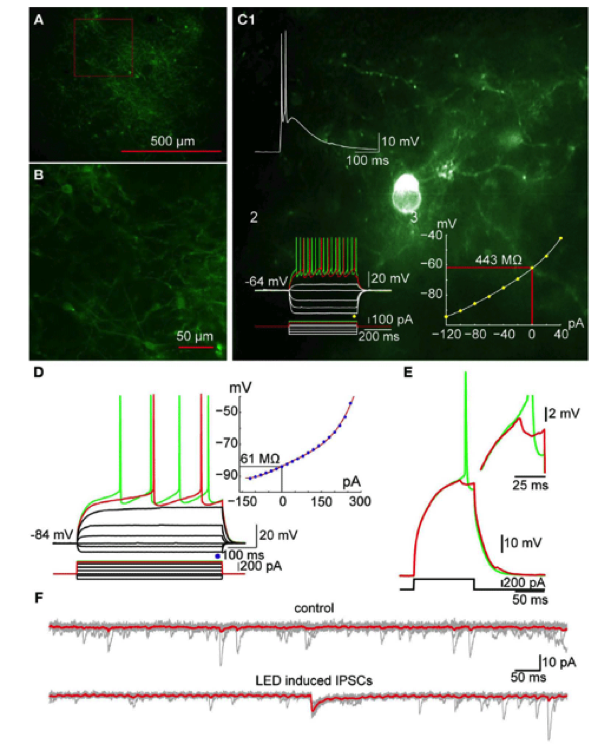
A. Photomicrograph of a parasaggital slice obtained from a TH-Cre mouse injected with AAV-2:EF1:DOI:CHR2-EGFP. Note the large area of infection (~1mm, in diameter). B. Higher magnification of the area indicated by the red rectangle in A showing numerous AAV-infected TH+ interneurons as well as axonal and dendritic processes expressing ChR2-YFP (green). C. Photomicrograph of a single ChR2 expressing striatal TH interneuron recorded in current clamp. C1: A 2 ms pulse of blue light elicits action potentials in the TH+ interneuron. C2: Responses to injected current identify the trasfected neuron as a Type II TH+ interneuron. C3: I-V plot from data in C2 is typical of Type II interneurons. D. SPN recorded in another ChR2-expressing striatal slice. Inset shows typical I-V characteristics. E. Action potential firing elicited in the SPN in D with current injection can be blocked by brief (2 ms) optogenetic stimulation of TH+ interneurons and axons. Inset shows the IPSP elicited in the SPN at higher magnification. F. Current traces obtained without (top traces) and with optical stimulation (bottom traces). Vh=-80 mV. Note the IPSC elicited in the SPN (bottom). From Tepper et al., (2010) Heterogeneity and diversity of striatal GABAergic interneurons. Front. Neuroanat. 4:150.
Optogenetically reproduced pause-burst sequence in striatal cholinergic interneurons elicits powerful inhibition in spiny neurons in vitro
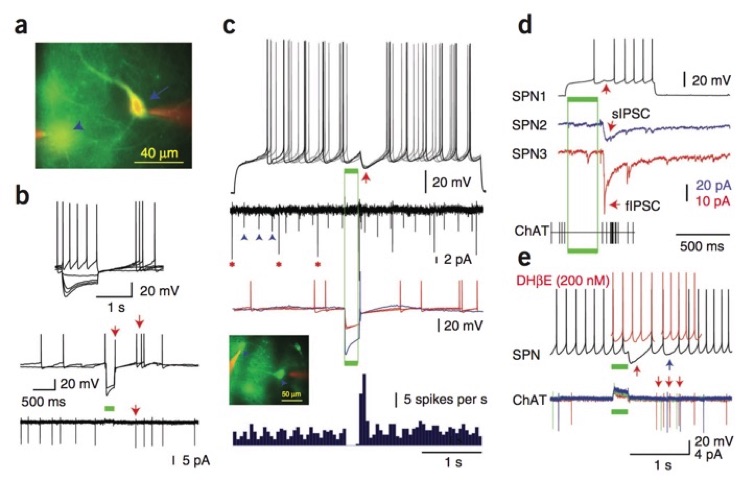
(a) Photomicrograph of eNpHR3.0-YFP– expressing ACh interneurons (arrow, arrowhead) labeled intracellularly with Alexa 594 (red). (b) Top, responses of an eNpHR3.0-YFP–expressing ACh interneuron to intracellular current (a, arrow). Whole-cell (middle) and cell-attached (bottom) recordings demonstrated spontaneous activity and large-amplitude optogenetic hyperpolarization (green bar) leading to rebound excitation (arrows). (c) Synaptic responses of a SPN to optogenetically induced pause-excitation of ACh interneurons. Top, rebound excitation of the interneurons triggered coincident large IPSPs (arrow) that blocked spike generation. Middle, spike trains of ACh interneurons using cell-attached (asterisks) and extracellular (arrowheads) recording (second trace from top) and in current clamp (color traces). Inset, eNpHR3.0-YFP–expressing ACh interneurons and cell-attached recording pipettes (red). Bottom, PSTH of ACh interneurons demonstrating pause-excitation activity. (d) Simultaneous recordings (blue and red) from two SPNs showing IPSCs elicited by the rebound activation of ACh interneurons (bottom) induced using eNpHR1.0-mCherry. Simultaneous recording from a third SPN showed optically elicited spike delay (top, arrow). Bottom, extracellular recording of an ACh interneuron (spikes, vertical lines) showed optical inhibition and rebound firing. (e) Top, short and long latency inhibition (black trace, red and blue arrows) in a SPN elicited by ChAT interneurons were blocked by DHβE (red traces). Bottom, cell-attached recording demonstrated long latency spikes in a ACh interneuron (arrows) coinciding with late inhibition. Note that the early inhibition is elicited by other ACh interneurons. From English et al., 2011, Nature Neuroscience, 15:123-130 doi: 10.1038/nn.2984.
